
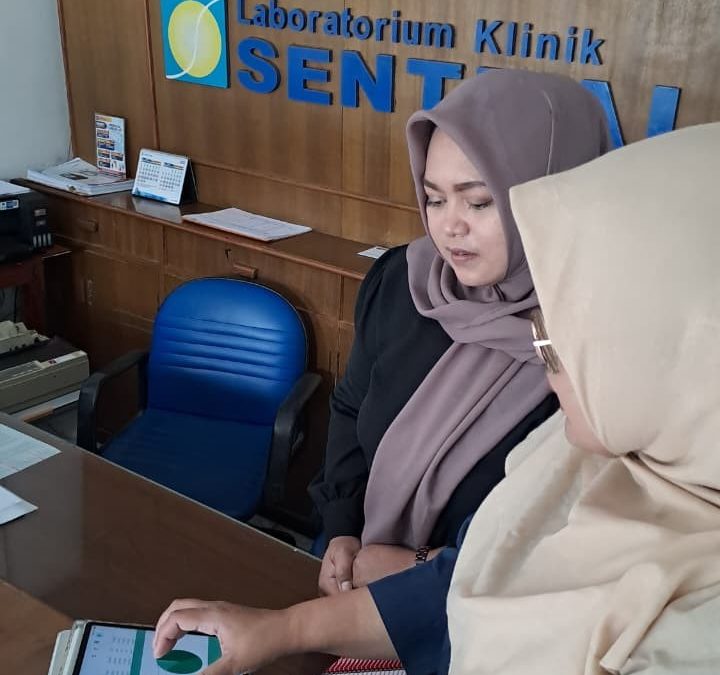
In order to carry out community service activities, the Department of Statistics held an activity entitled “Optimizing the Spreadsheet Dashboard as a Data Governance Instrument in Agencies” which was held on March 28, 2026 at the Central Clinical Laboratory.
This activity aims to increase the effectiveness of data management in agencies through the use of an integrated and easy-to-use spreadsheet dashboard. As the need for fast and accurate data processing increases, spreadsheet dashboards are becoming one of the practical solutions in supporting the monitoring process and data-driven decision-making.
Through this activity, the service team provides assistance in the development of a spreadsheet dashboard designed according to the needs of the agency. The dashboard produced contains various important information, including a summary of patient data, types of examinations, queue status, and abnormal examination results. The visual and structured presentation of data is expected to facilitate the real-time data monitoring process and improve service efficiency.
In addition to the implementation of the dashboard, this activity is also a means of knowledge transfer related to systematic and sustainable data governance. With the optimization of the spreadsheet dashboard, agencies are expected to be able to improve the quality of information management while supporting more effective and responsive services.
This community service activity is a form of real contribution of the Department of Statistics in implementing statistical science and data processing to support the needs of agencies and strengthen data-based work culture.